Reports and analytics
Cannabis retail reports, VAT and margins in one console.
Open the console before you open the shop. Yesterday's takings, what sold, what it earned and what the VAT on it was, for one branch or for every branch you own, on whatever screen you happen to be holding.
- Revenue, transactions and average basket on one screen
- VAT recorded as you trade, not reconstructed in February
- Sales, stock, staff and day-end reports in Excel or PDF
- Any report scoped to one shop or to all of them
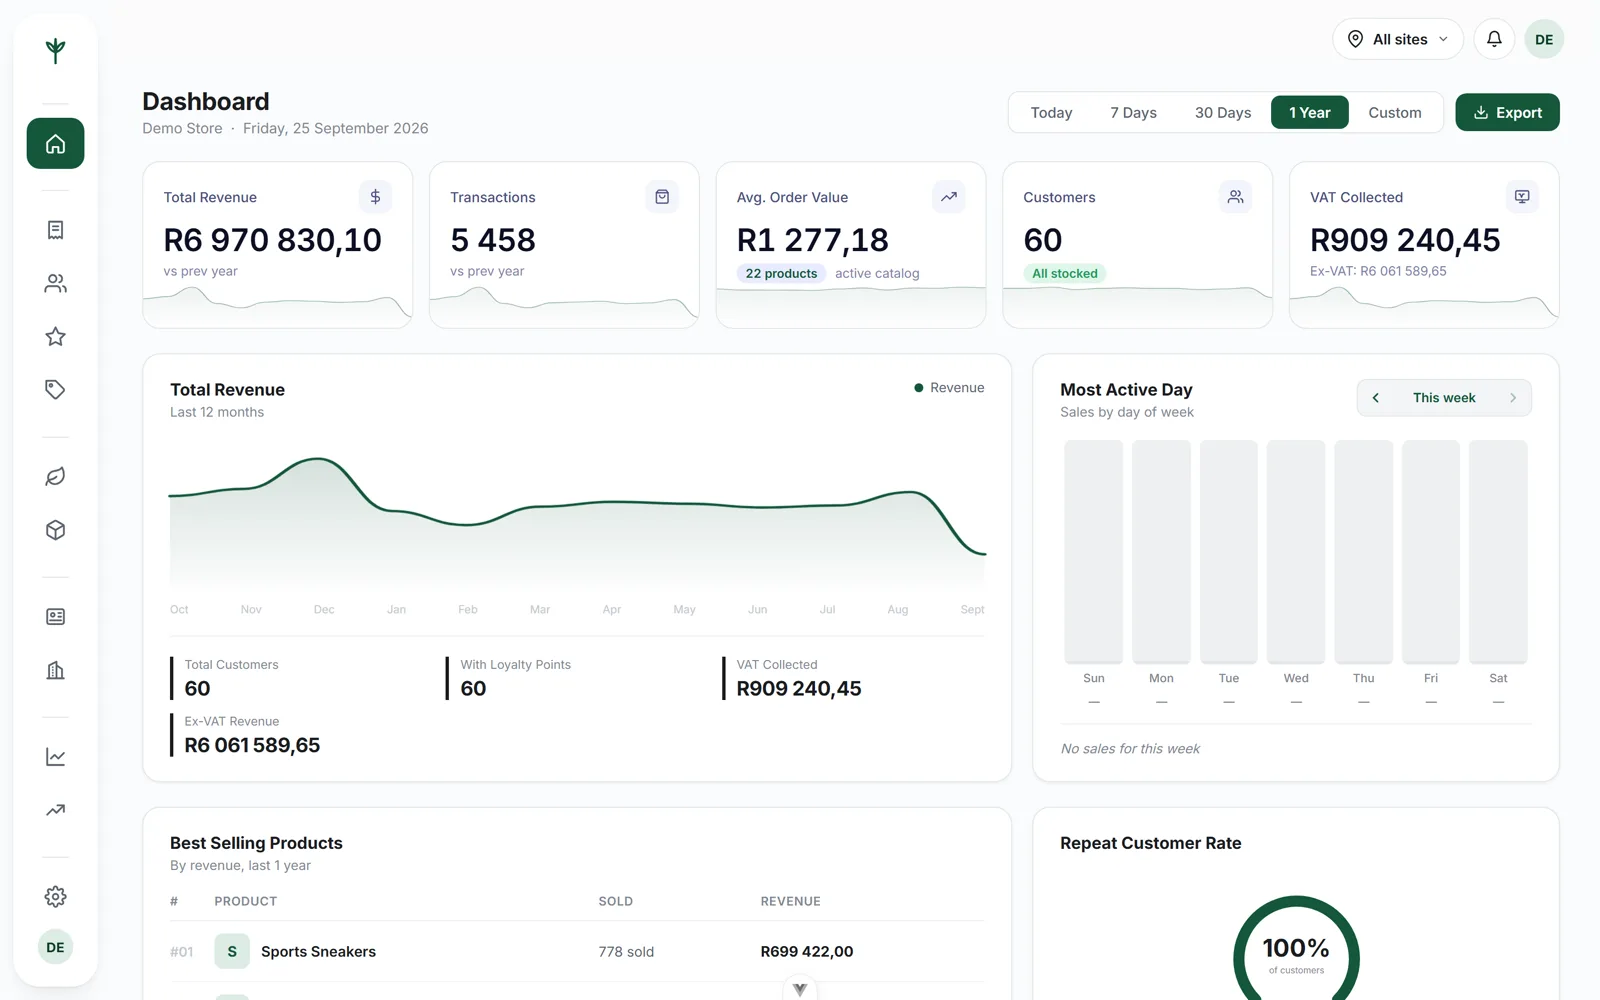
The dashboard
Four numbers that tell you how the shop is doing
Not a wall of charts. The figures a shop owner checks first, in the order they actually matter, with the best sellers underneath them.
Revenue
What came through the door over the period you choose, and how that compares with the period before it.
Transactions
How many sales made that revenue. Two shops can take the same money in very different ways.
Average basket
The number that moves when staff start suggesting a second item, and the fastest thing in the shop to improve.
VAT
Recorded on every sale as it happens, so the figure you owe is already there when the return is due.
And the best sellers, which is where the arguments start
Everyone in the shop has a theory about what moves. The dashboard settles it with the list of what actually left the shelf over the period you picked, for the branch you picked.
The year, at a glance
Change what you are looking at, not where you are looking.
The same twelve months, three different questions. Pick one.
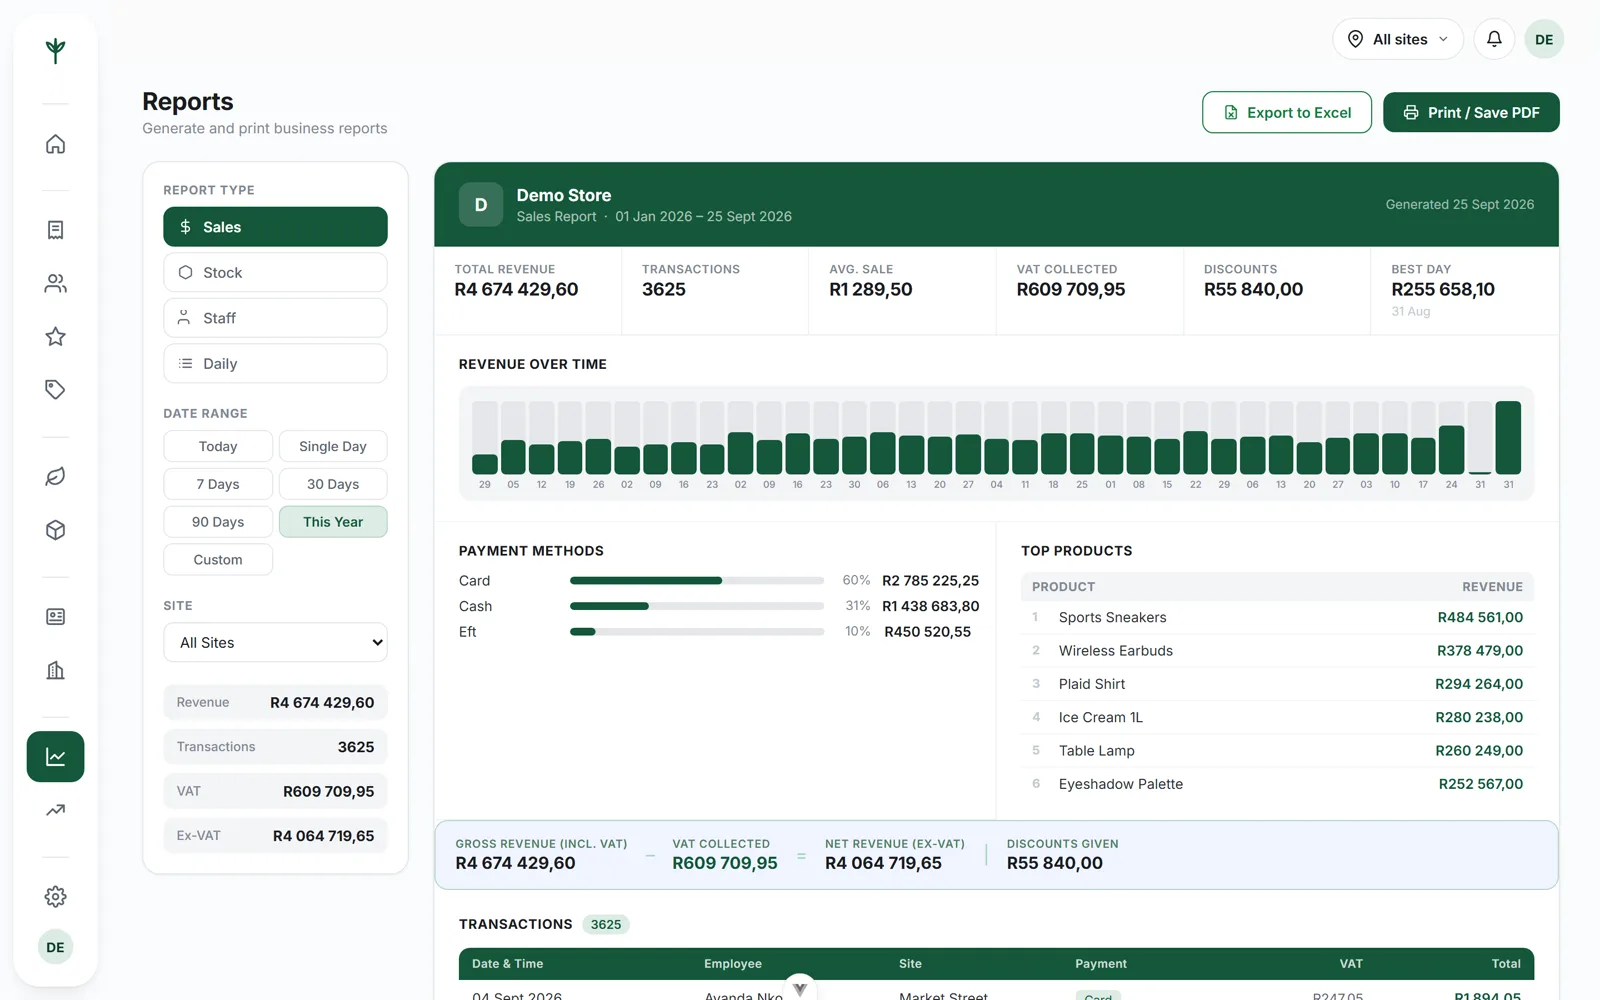
Reports
Four reports, four different questions.
A dashboard is for a glance. A report is for when you need to know something specific, usually because a number looks wrong or somebody has asked you for proof. CannyPos keeps them separate on purpose.
- Sales. What sold, when, at what price, with what discount, and how it was paid for. Cash, card, EFT and split all land here.
- Stock. What you are holding and every movement behind it, fed straight from per-branch stock control.
- Staff. Who rang up what, who discounted, who voided and why. Each cashier signs in with their own PIN, so the name on the sale is real.
- Day-end. The cash-up. Takings by payment type against what is in the drawer, so the day closes on a figure everyone agrees with.
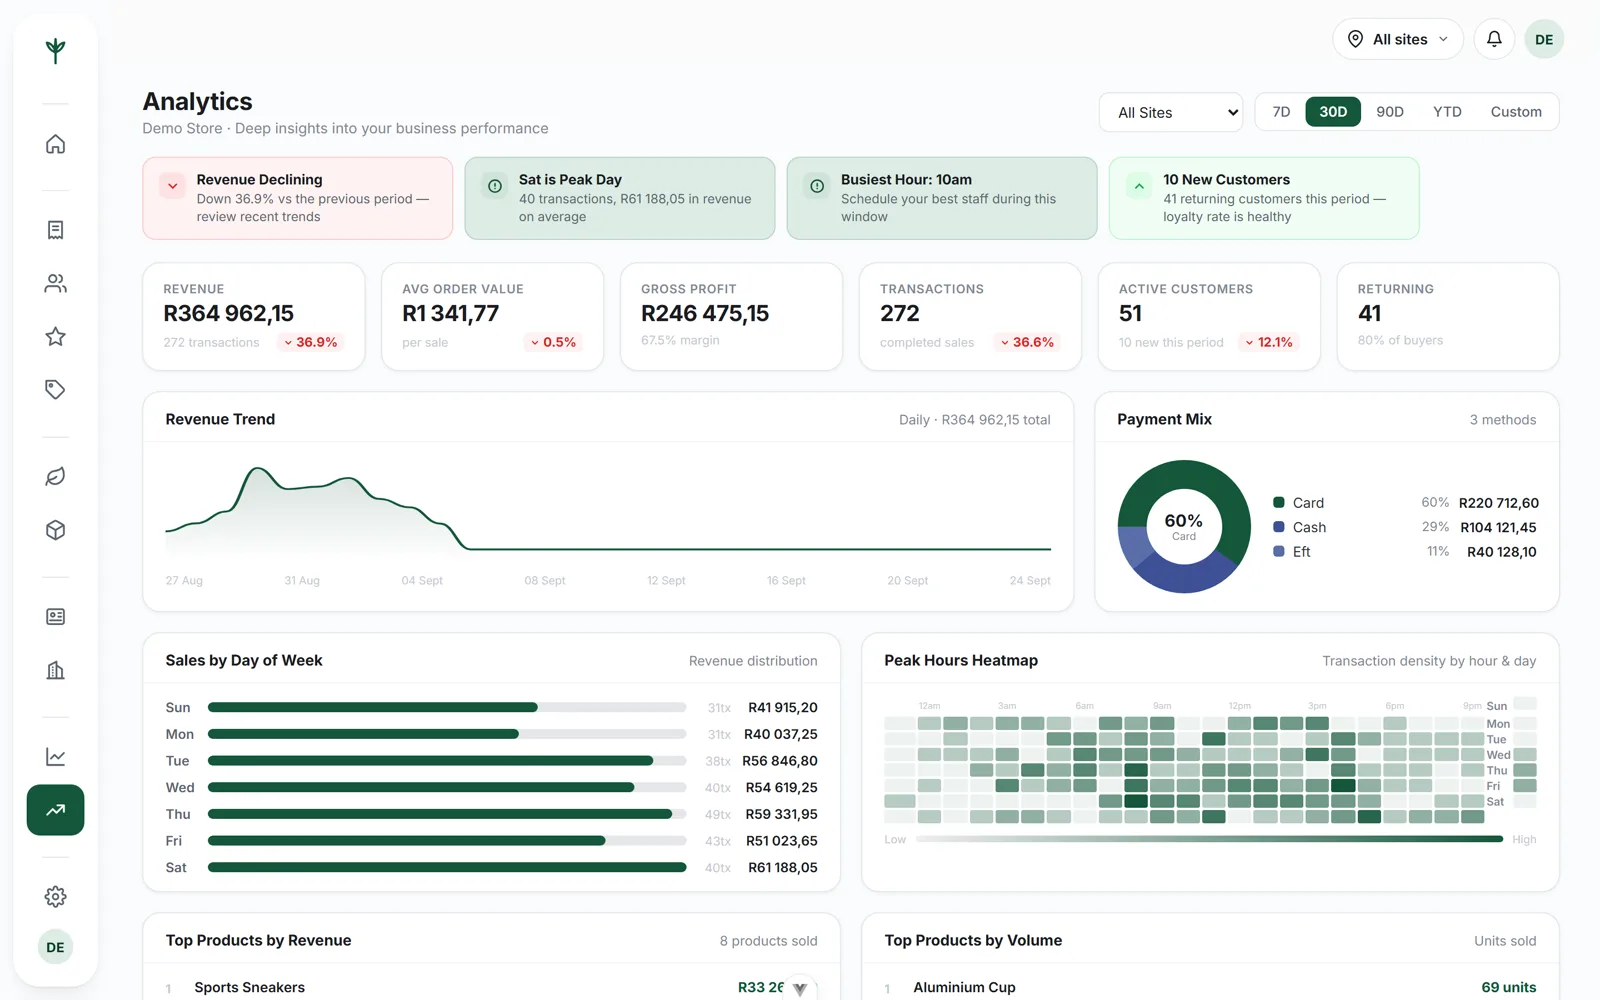
Analytics
The best seller is not always the product making you money.
Volume is flattering. The line at the top of the best sellers list is often the one with the thinnest margin, bought by people who would have bought something else if it had not been sitting there at the front of the grid.
Analytics puts the two side by side. What is selling, what it cost you, and what it left behind once the discount and the member benefit were taken off. That is the view that changes what you order, where you put it on the shelf, and what you stop stocking altogether.
It is also the honest test of a promotion. A week of heavy discounting can look like a very good week on revenue alone, and rather less good once you look at what it actually earned.
One branch or all of them
Change the scope, keep the report.
Every report and every dashboard figure can be pointed at a single branch or run across the whole business. That is one switch, not a different report, so the comparison is genuinely like for like.
It is how you find out that one shop's average basket is well under the other's, or that a product flying out of one branch has been sitting in the other for a month. Owners tend to spend most of their time in the all-branches view and drop into a single shop the moment something looks odd. More on that on the multi-store page.
Excel for the accountant
Exports open in a spreadsheet and are built to be worked in, not retyped out of a PDF.
PDF for everyone else
When the figure just needs to be read and filed, send the PDF and be done with it.
Pick your period
A day, a week, a month or a year. The dashboard and the reports follow the same dates.
Your data stays yours
Export whenever you like, as often as you like. Nothing about your own numbers is held back from you.
Questions
Reporting, answered
Can I export reports for my accountant?
Yes. Every report exports to Excel or PDF. Excel is what an accountant wants to work in, and PDF is what you send when the figure simply needs to be read.
Does CannyPos work out the VAT?
CannyPos records the VAT on your sales as you trade and shows it on the dashboard and in the reports, so the figure is ready when the return is due. Your accountant still files it.
Can I look at one branch on its own?
Yes. Any report can be scoped to a single branch or run across all of them, so you can compare shops or dig into the one that looks wrong.
Can I check today's takings from my phone?
Yes. The console runs in a browser, so you can open the dashboard on your phone and see today's takings across every branch without going in.
Stop guessing what last month did.
Fifteen minutes on the console, with your questions. Or read what CannyPos does end to end.